
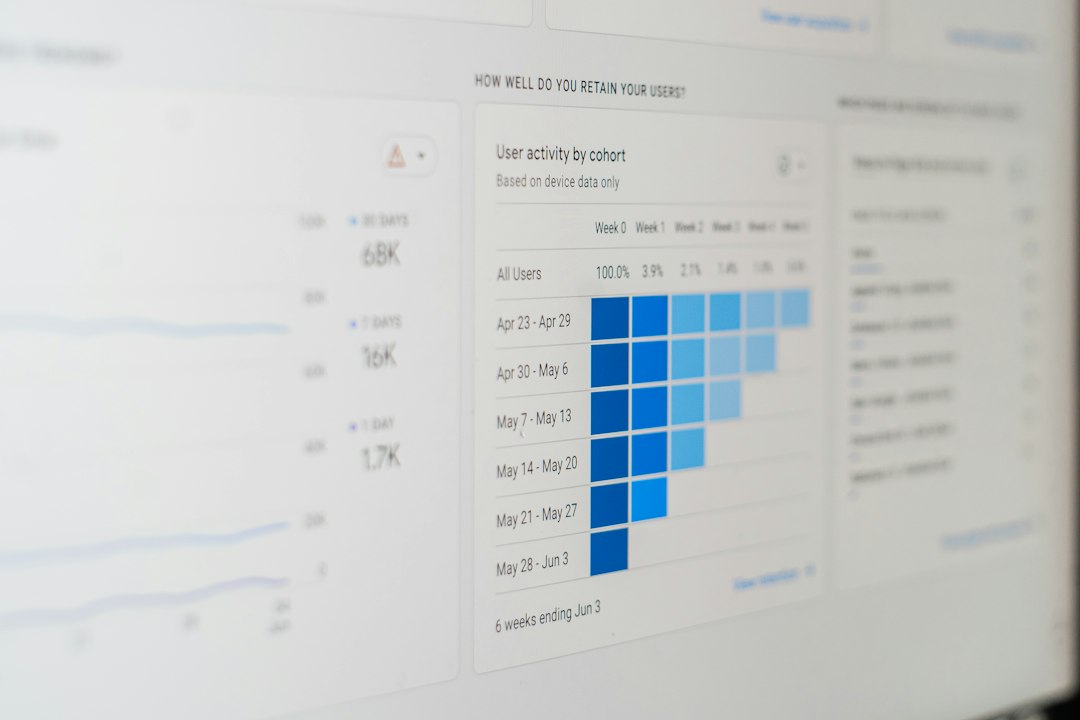
Pick Sentry first if your main pain is broken code reaching users. It is simple, fast to set up, and built for developers who need answers now. Sentry lists a free Developer plan, plus paid Team and Business plans on its pricing page, with Team shown at $26 per month at the time of writing [source: Sentry].
TLDR: Sentry is great for error tracking, performance traces, session replay, and release health. For example, a 6 person team shipping 4 times per week could use Sentry to spot a crash spike after a release and roll back before 30% of users get hit. Datadog and New Relic are better if you also need deep infrastructure and log monitoring. Rollbar is a simpler pick if you mostly want clean error alerts without a giant control room.
Sentry pricing in plain English
Sentry has a free plan for small projects and solo developers. That is handy. You can catch errors, track releases, and see basic performance issues without asking finance for a card.
The paid plans add more volume, more controls, and more team features. The rough path looks like this:
- Developer: Free. Best for side projects and testing.
- Team: Paid monthly. Good for small teams shipping real apps.
- Business: Higher price. Better for growing teams with more rules and reports.
- Enterprise: Custom. Best for larger companies with compliance needs.
The catch is usage. Error events, performance spans, replays, and attachments can raise the bill. If your app is noisy, pricing can feel like a leaky faucet. One bad release can spray thousands of events in minutes.
1. Sentry: Best for developer first error tracking
Sentry shines when developers need to fix bugs fast. It groups errors. It shows stack traces. It links issues to releases. It can show which commit likely caused the problem. That feels good when a bug wakes you up at 2 a.m.
Sentry also covers performance monitoring. You can see slow API calls, frontend lag, and database delays. Session Replay is useful too. It lets teams watch what happened before a user hit an error. That can save hours of guessing.
Best for: SaaS teams, mobile apps, JavaScript apps, backend services, and teams that ship often.
Annoying bit: Event volume needs babysitting. You may spend time tuning filters so junk errors do not eat your plan.
2. Datadog: Best for full stack monitoring
Datadog is the “show me everything” tool. It covers APM, logs, servers, containers, databases, browser tests, cloud costs, and more. If your team runs many services, this is powerful.
Datadog pricing is usually split by product. APM is priced per host. Logs are priced by ingest and retention. Real user monitoring has its own meter. This can be fair. It can also get messy fast. Honestly, it feels like ordering pizza and finding out every topping has a separate invoice.
Datadog says its APM plan starts at a per host monthly price on its pricing page [source: Datadog]. Check the page before buying. Big usage changes the math.
Best for: Platform teams, DevOps teams, Kubernetes users, and companies that need logs, metrics, traces, and alerts in one place.
Annoying bit: The bill can be hard to predict. Tags, hosts, containers, logs, and extra modules all matter.
3. New Relic: Best for broad observability with a friendly free tier
New Relic gives teams APM, infrastructure monitoring, logs, browser checks, mobile monitoring, and synthetic testing. It is strong for teams that want one home for many signals.
The pricing model is based on data and users. New Relic offers a free data amount each month, then charges for more usage. Users can also affect cost. This model is nice if your data is clean. It can sting if your logs are chatty.
New Relic can feel easier than Datadog for some teams. The UI is clean. The setup is not painful. The dashboards are useful. Still, expect to waste time naming things well. Bad service names make any monitoring tool feel like a junk drawer.
Best for: Teams that want APM plus infrastructure and log data without building a huge toolchain.
Annoying bit: Data ingest can creep up. Old debug logs love to eat budgets.
4. Rollbar: Best for simple error tracking
Rollbar is more focused than Datadog or New Relic. It watches errors. It groups them. It alerts the right people. It helps teams understand what broke and who was affected.
That focus is the charm. Rollbar is easy to understand. Developers do not need a week of training. You add the SDK, ship it, and start seeing errors.
It is not as wide as Datadog. It is not as developer rich as Sentry in some workflows. But if you want error tracking without a giant monitoring suite, it fits.
Best for: Small teams, agencies, product teams, and apps that need clean error reports.
Annoying bit: You may need another tool for deep performance, logs, or infrastructure monitoring.
Quick comparison
| Tool | Best use | Pricing style |
|---|---|---|
| Sentry | Error tracking plus performance for developers | Free plan, then paid tiers and usage |
| Datadog | Full stack monitoring | Per product, host, and usage |
| New Relic | APM, logs, infrastructure, and user data | Data plus users |
| Rollbar | Simple error tracking | Plan based, often tied to event volume |
Which one should you choose?
Choose Sentry if developers own app quality and need fast bug context. It is the best default for many software teams.
Choose Datadog if your app runs on many services and your ops team needs one big control panel.
Choose New Relic if you want broad monitoring with a data based model and a strong free start.
Choose Rollbar if you mainly need error tracking and want less noise.

The simple rule is this. Start with the pain. If bugs are the pain, pick Sentry or Rollbar. If systems are the pain, pick Datadog or New Relic. Your future self will thank you when the next release goes sideways.